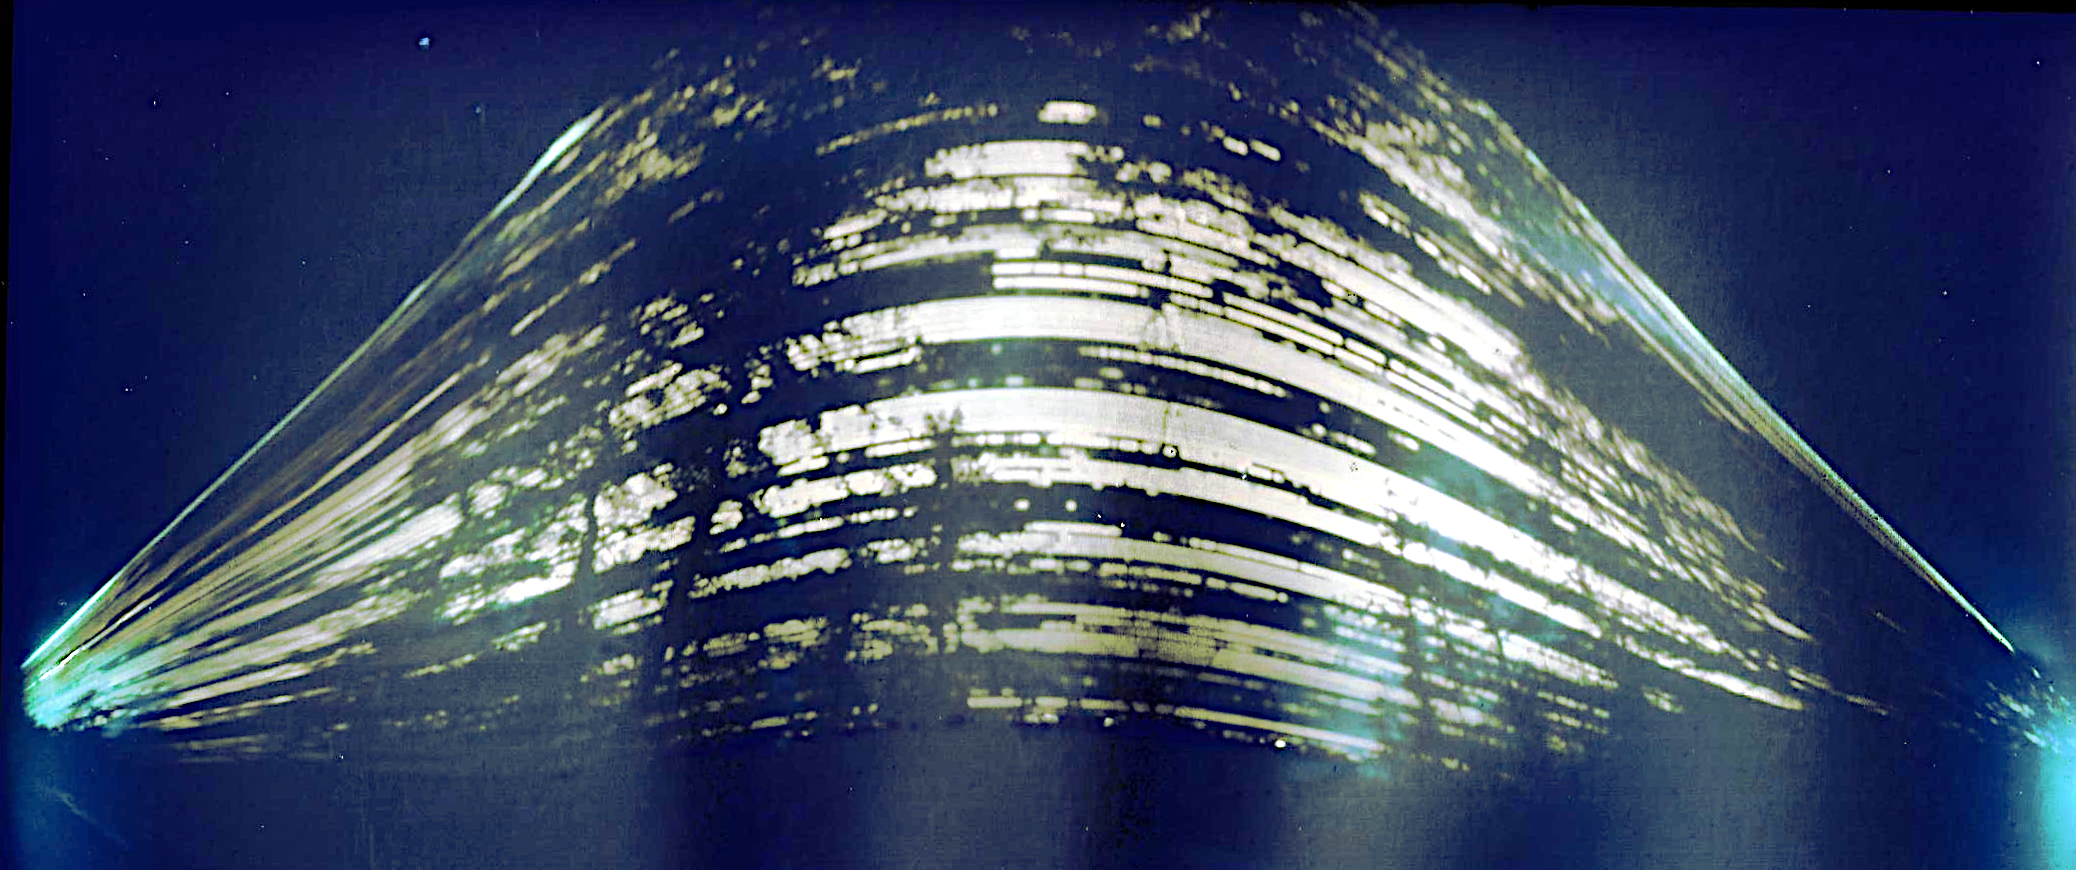
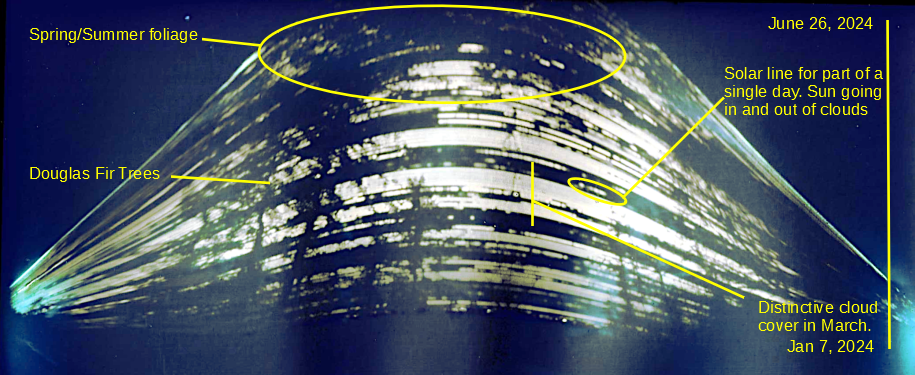
What you are seeing are streaks of the sun as it goes across the sky. As the season progresses from Winter to Summer, the sun goes higher in the image. Silhouetted are trees in our yard and other foliage. The streaks themselves are also broken up by cloud cover. I was able to corrolate the streaks with a weather service’s cloud cover chart.
This was a fun, low-maintenance, project. I am dissapointed the upper image got cut off, but I am not sure there was room. Perhaps it is due to our latitude where the sun has a wide range in the seasons. I was surprised that I think I can see the individual streaks that I assume are days. It was cool to see it match up to the historical weather record.
Nothing special, but this was about the max occlusion from our house. We were lucky to see something through the clouds.
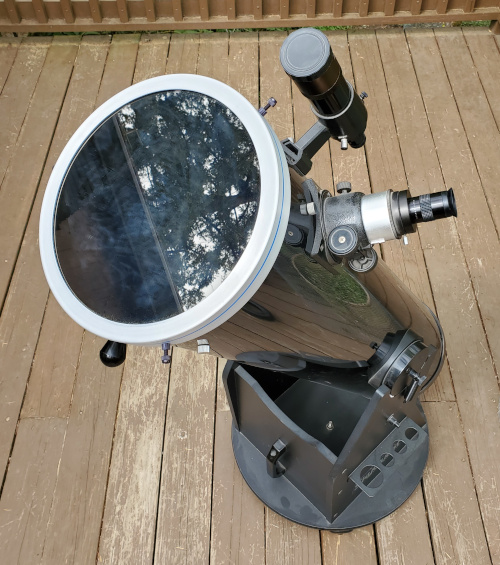
Through a telescope with a solar filter, we could see several sunspots. The smaller one on the upper right (region 3633 at 120MH) is about the size of the Earth (170 MH), the speck towards the center is quite a bit larger (region 3628 260 MH).
The video was with the telescope and into my cell phone, not really fancy astrophotography, but still kinda cool to me. I liked seeing the clouds go by, so I thought I’d share.
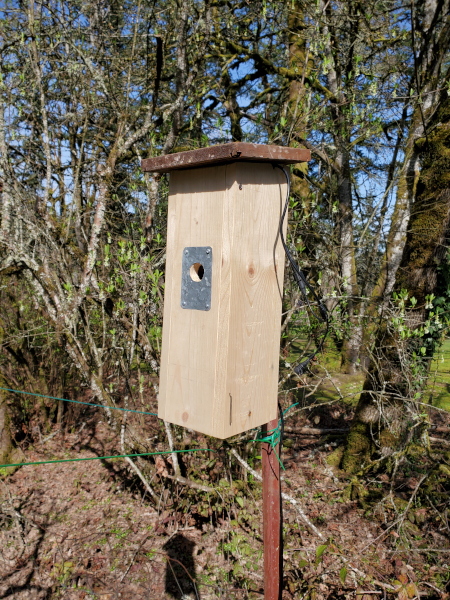
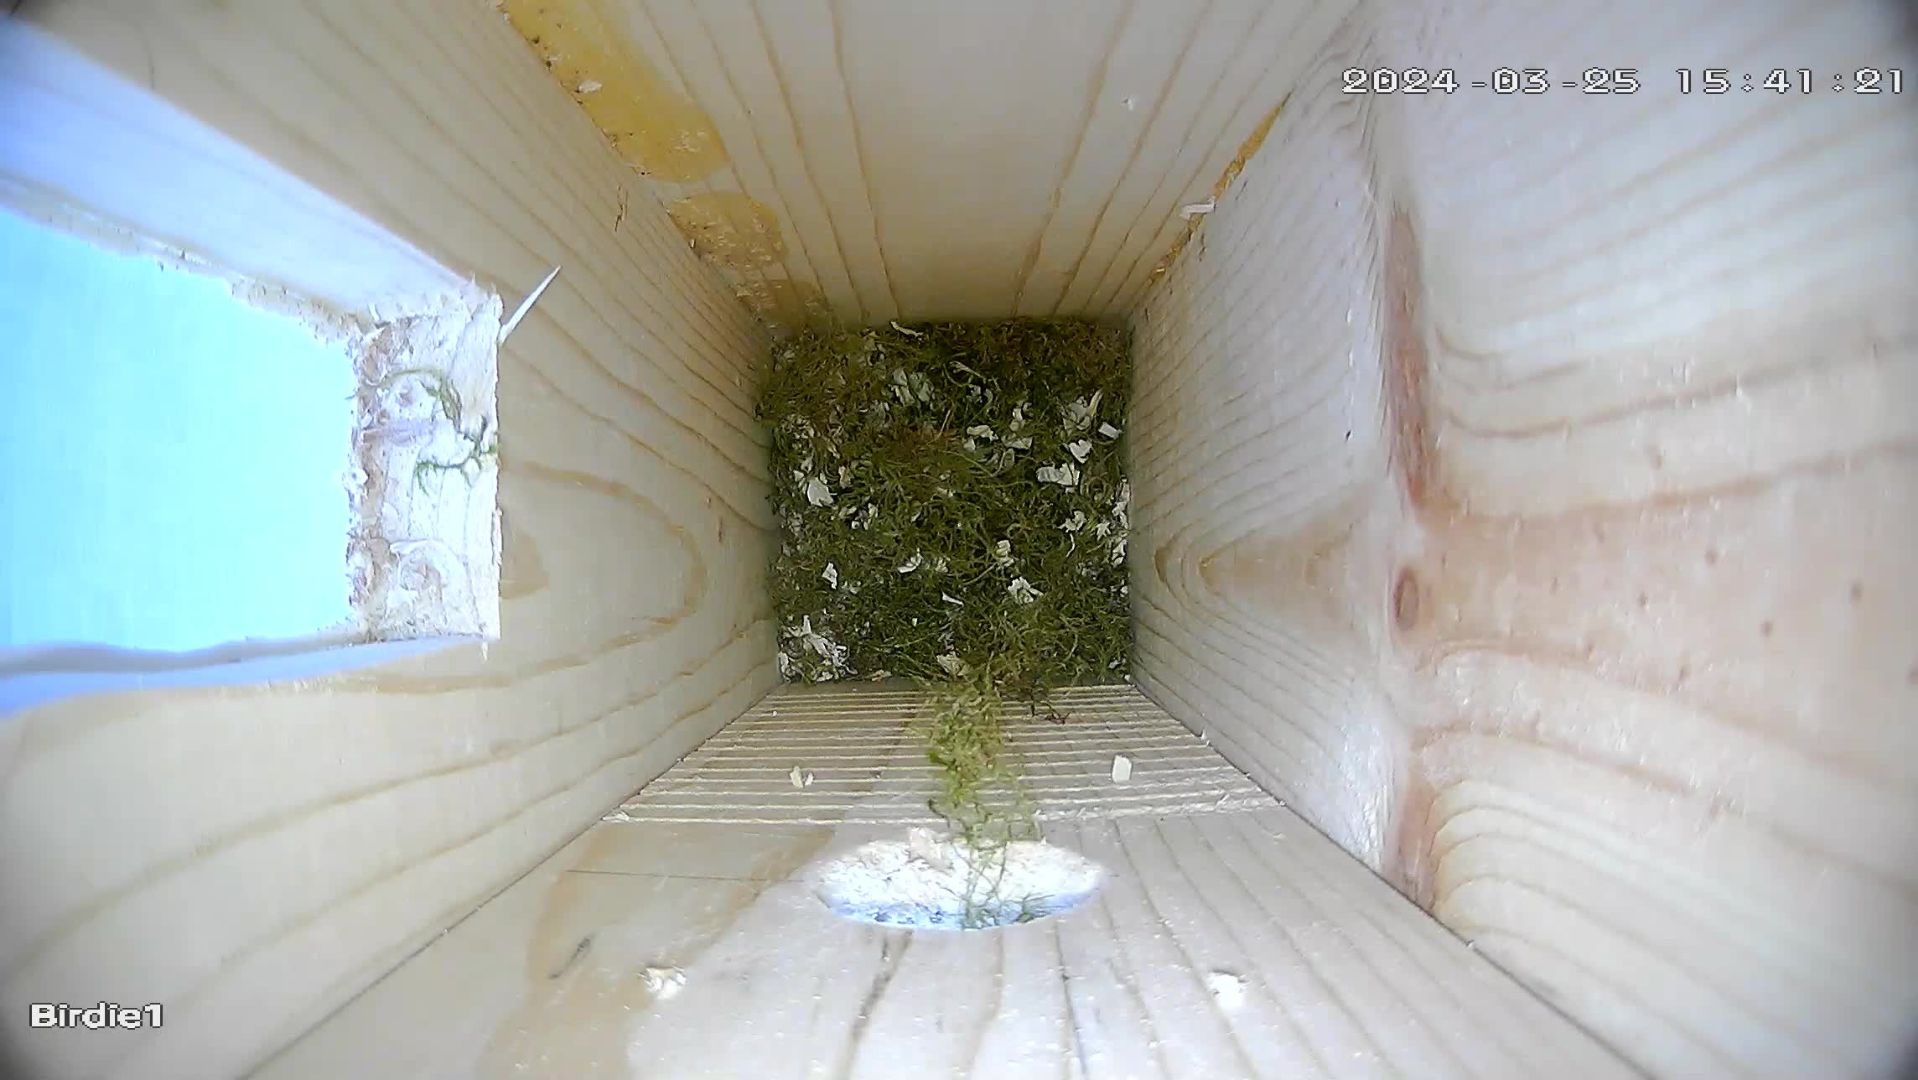
I kept the same camera, but lengthened the house. This gives more entry-to-floor depth and is inline with what’s recommended for chickadees. This also allowed me to add maybe 3″ of wood shavings. The birds apparently like being able to remove shavings to get the depth they prefer. Further, there is more height to the camera. Last year I noticed birds kept looking up at the camera, so I hope this gives them a bit more breathing room.
Other changes are a roof that overhangs all four sides, as I saw water leaking in the backside last year. There is a bracket allowing it to be installed on a “T” stake.
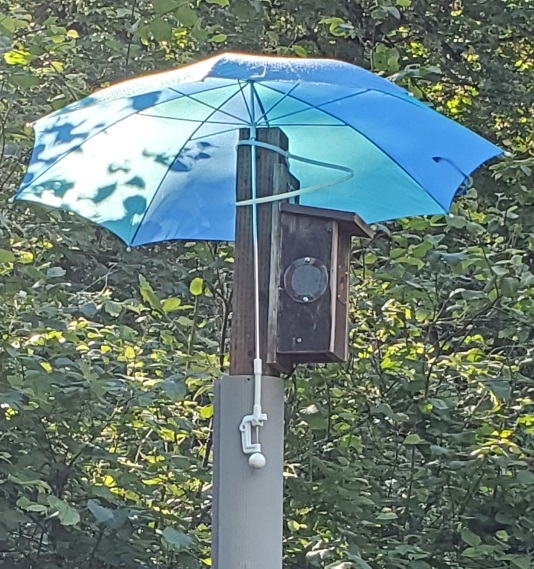
I moved the location to be more in the shade, so we won’t need to set up an umbrella on hot days!
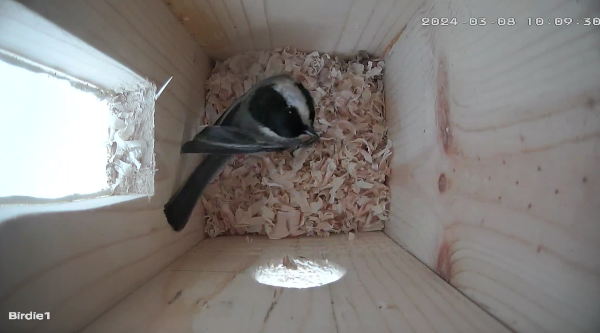
I understand chickadees nest around mid-March in our area and while I had installed the house on the stake, I had not plugged in the camera. The other day, I noticed birds flirting around the opening, so I finished up the job. The next day the camera showed a customer checking out the digs.
No one has moved in yet, but we’ve seen a few beaks peeking in the entry and a few birds have come inside to check things out!
3/19/2024 Update
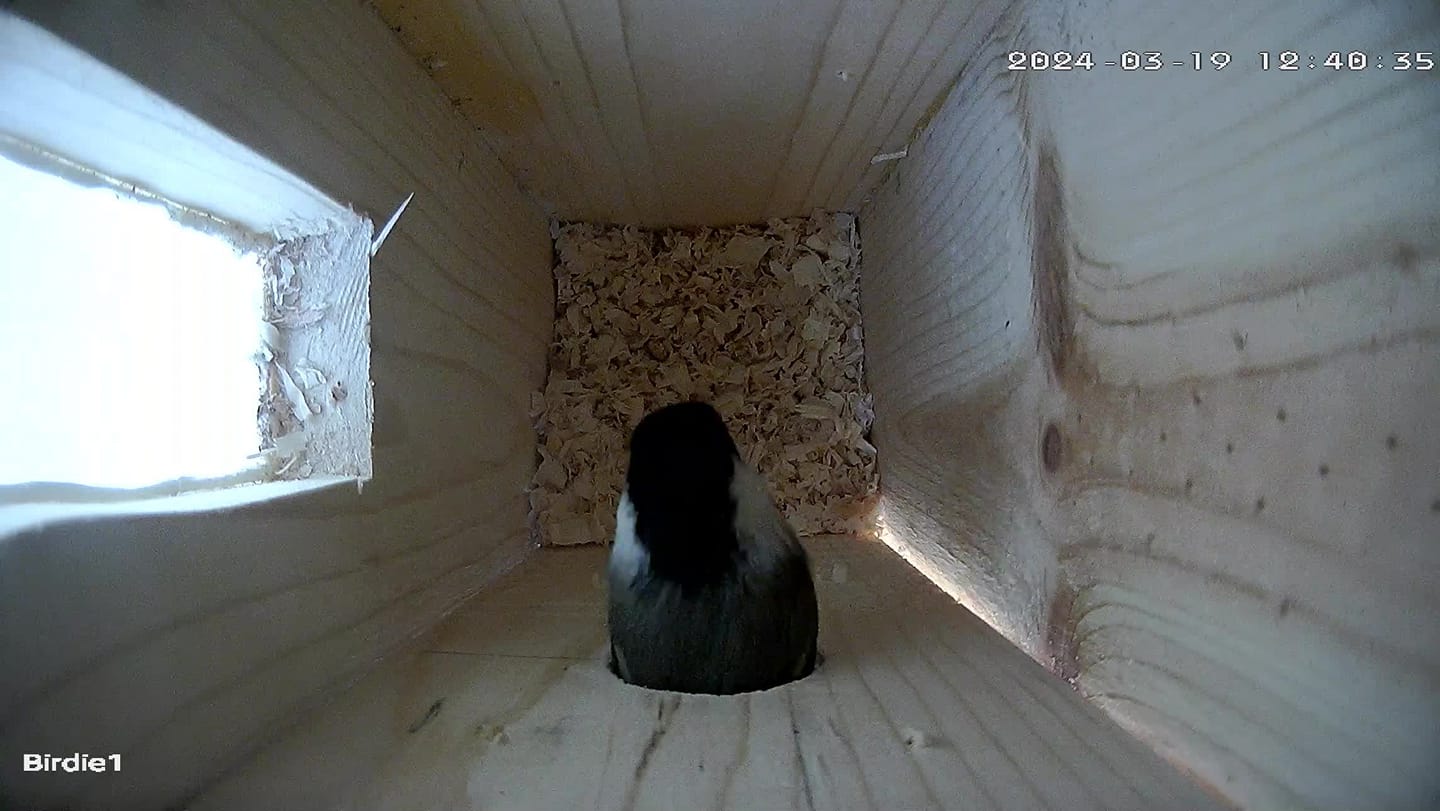
Over the weekend, checkadees began to visit the box several times an hour in the morning. They’ve been removing the wood shavings and dropping several feet away from the box. It looks to be about 1.5″ – 2″ of material has been removed so far.
3/26/2024 Update
We’ve noticed the chickadees began putting moss in the nest the other day. They’ve also pecked a bit at the interior. Last year there was quite a bit of moss, and then a layer of feathers. I think the’ve got more moss to go.
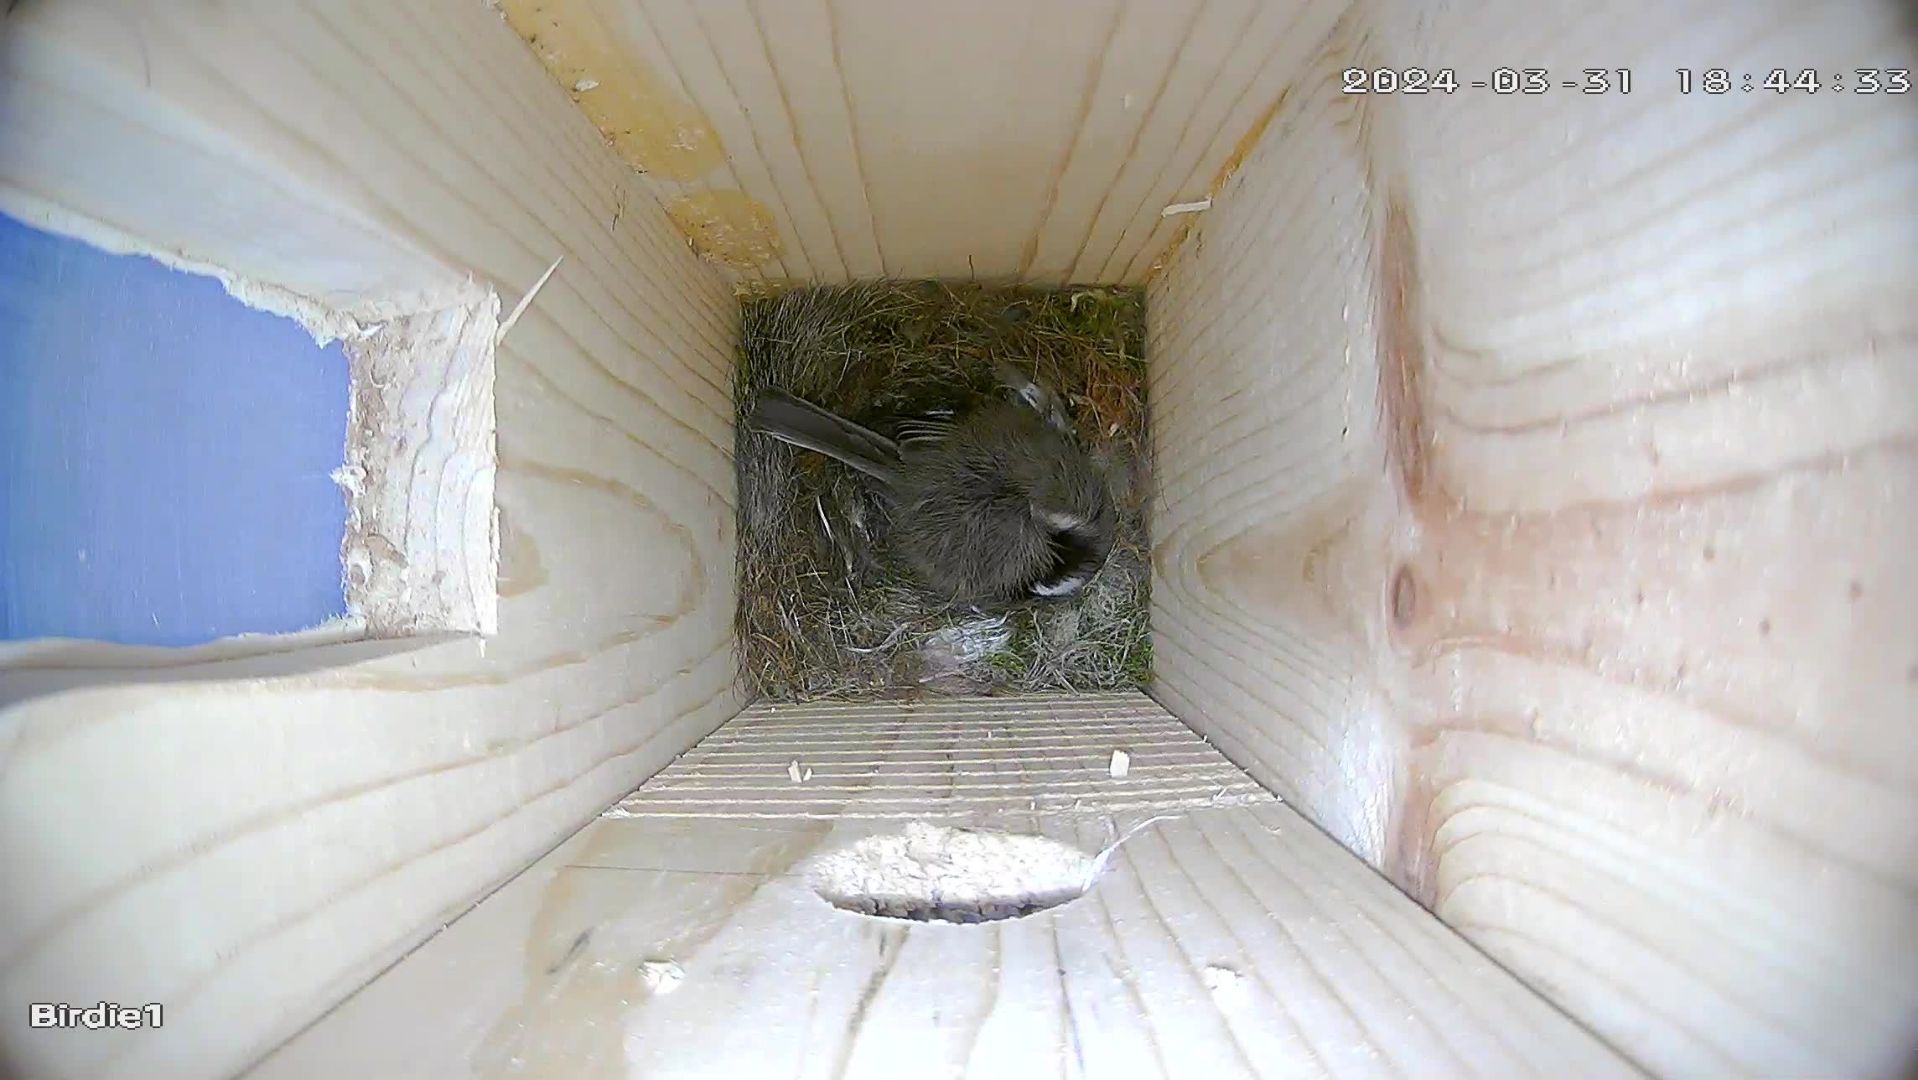
3/31/2024
When we checked today, it appears that one bird is now more or less staying in the nest.
4/16/2024
We might have an egg or more. One bird is in the nest pretty much all the time. When they leave, they may be covering something. We’ll see if we can get a picture.
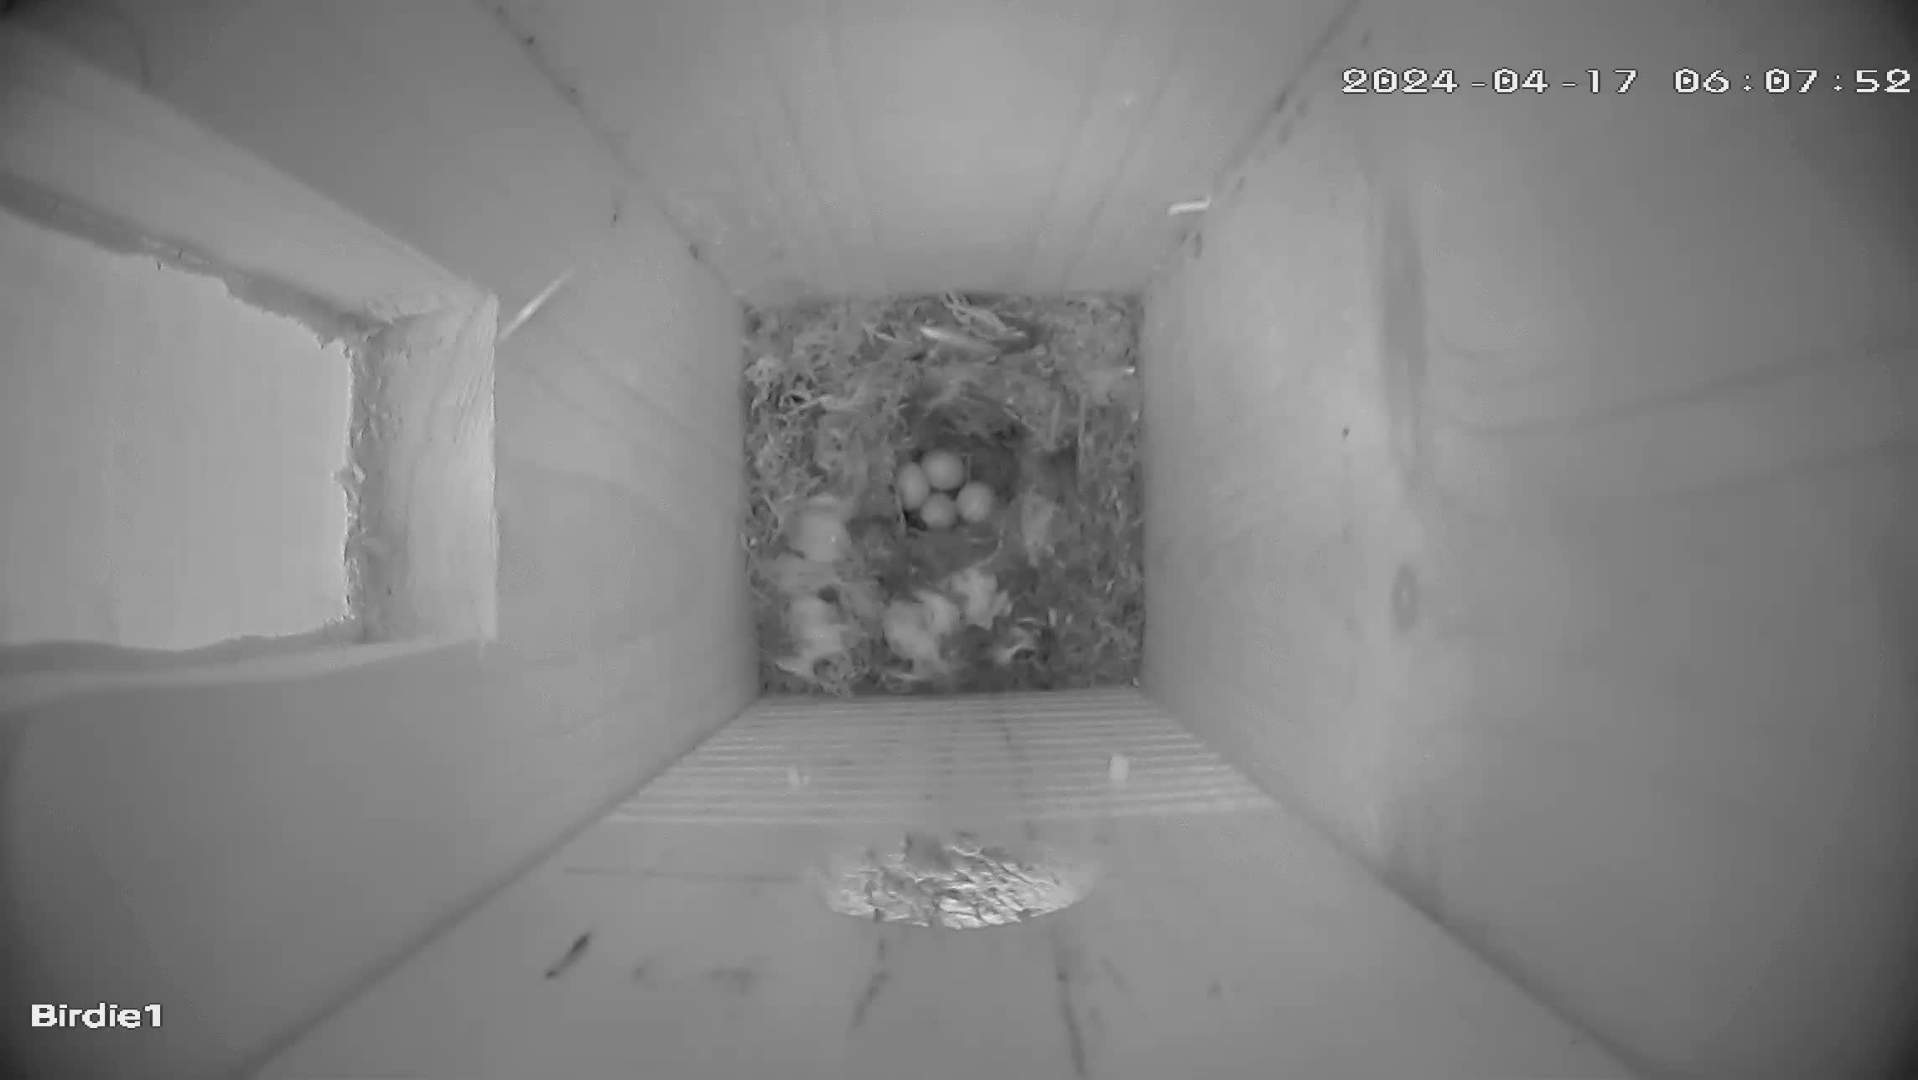
4/17/2024
Yup, we have not just one egg but 4! The bird was definetly covering up earlier, but it was warmer today, so maybe the felt okay with leaving them uncovered.
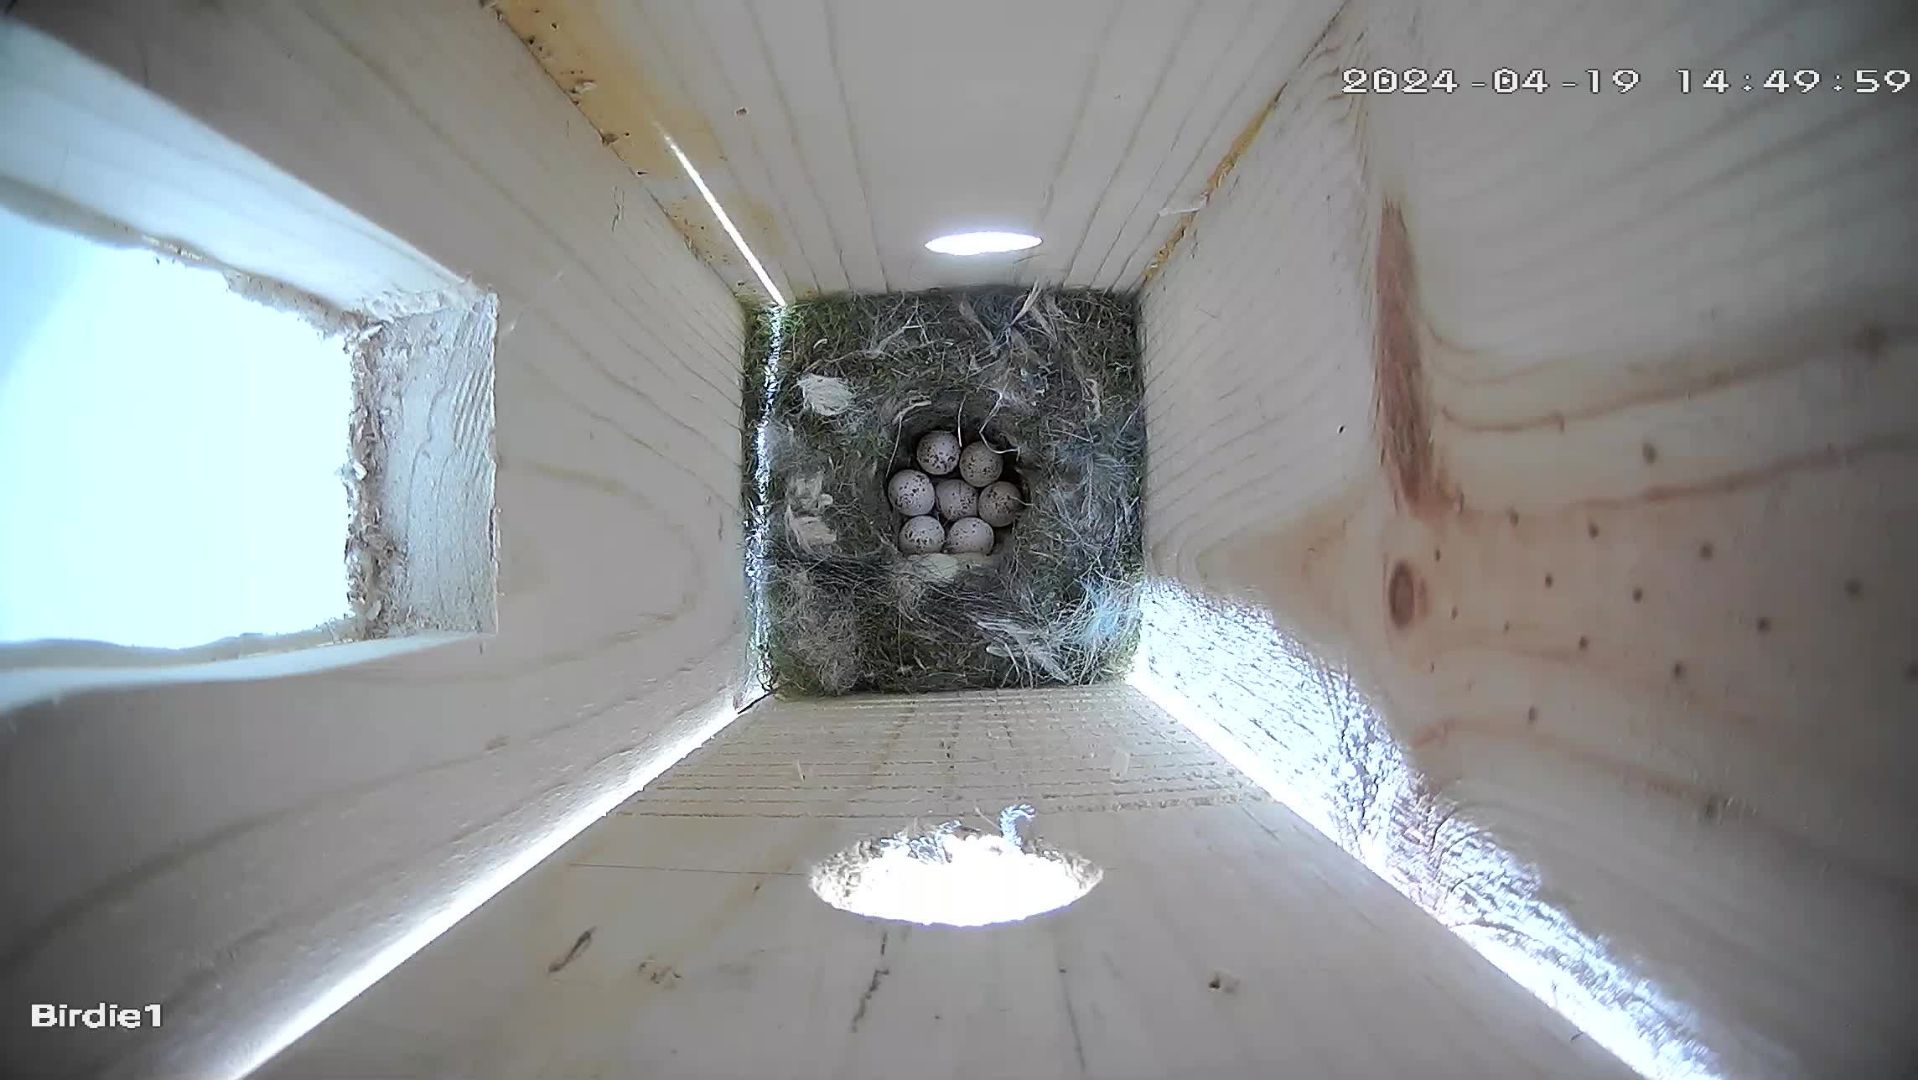
4/19/2024
And then there were eight!
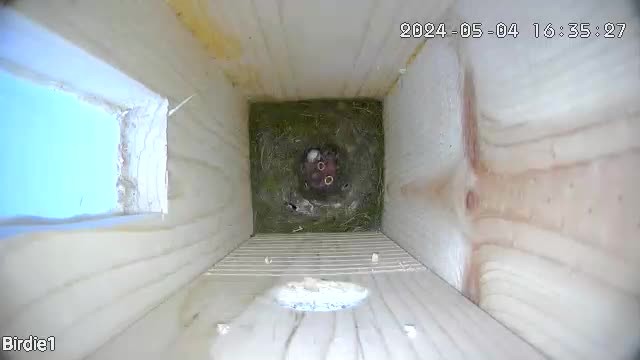
5/4/2024
Some birdies have hatched!
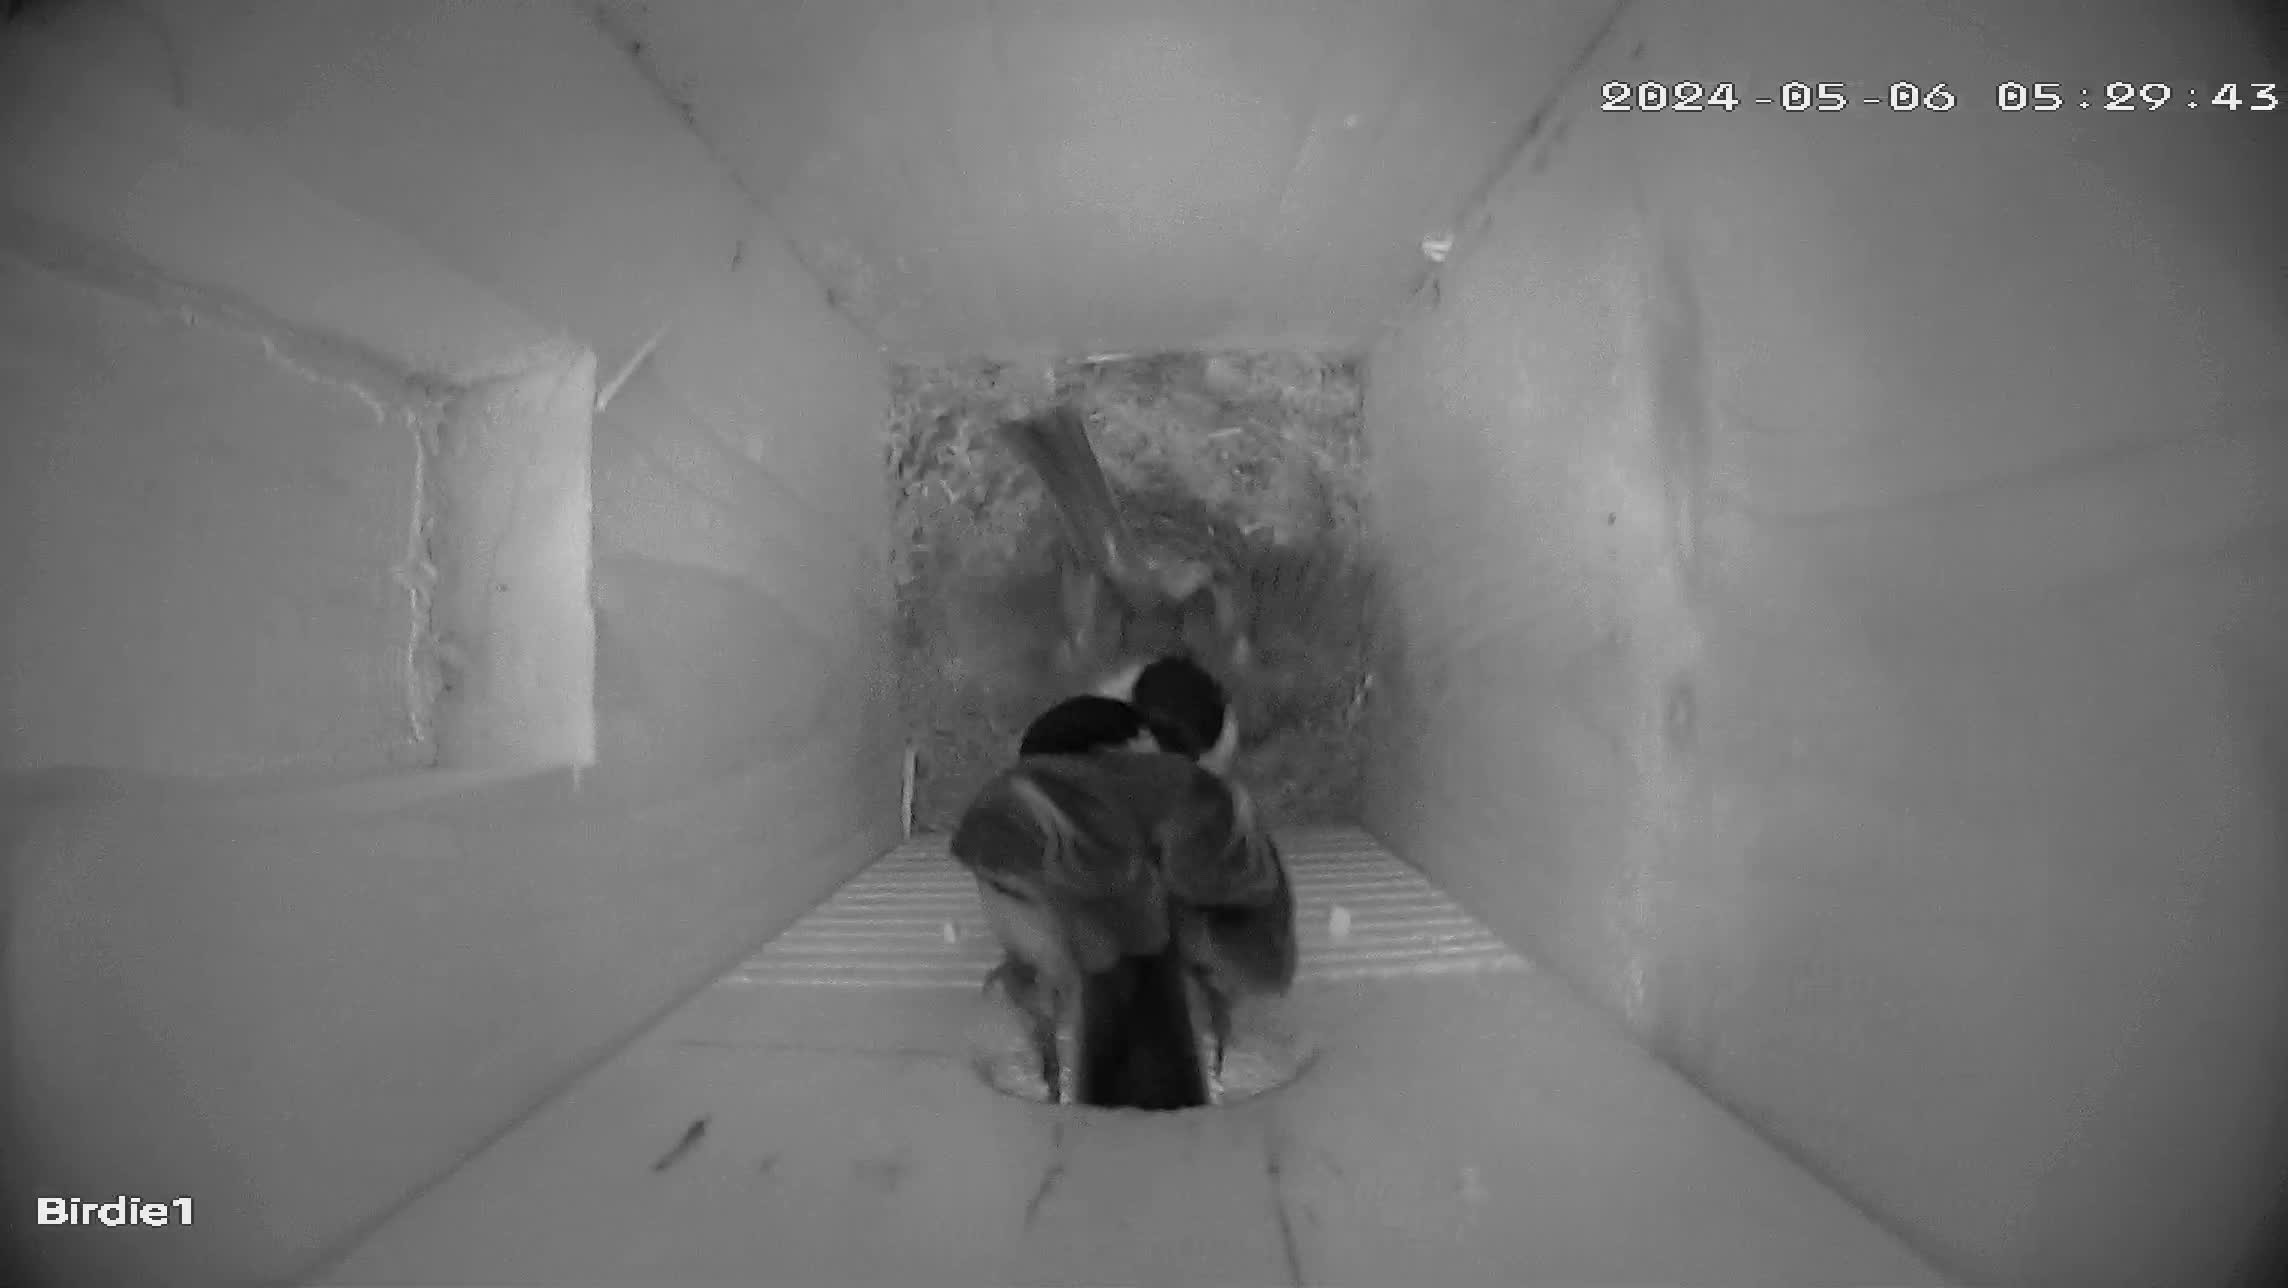
5/6/2024
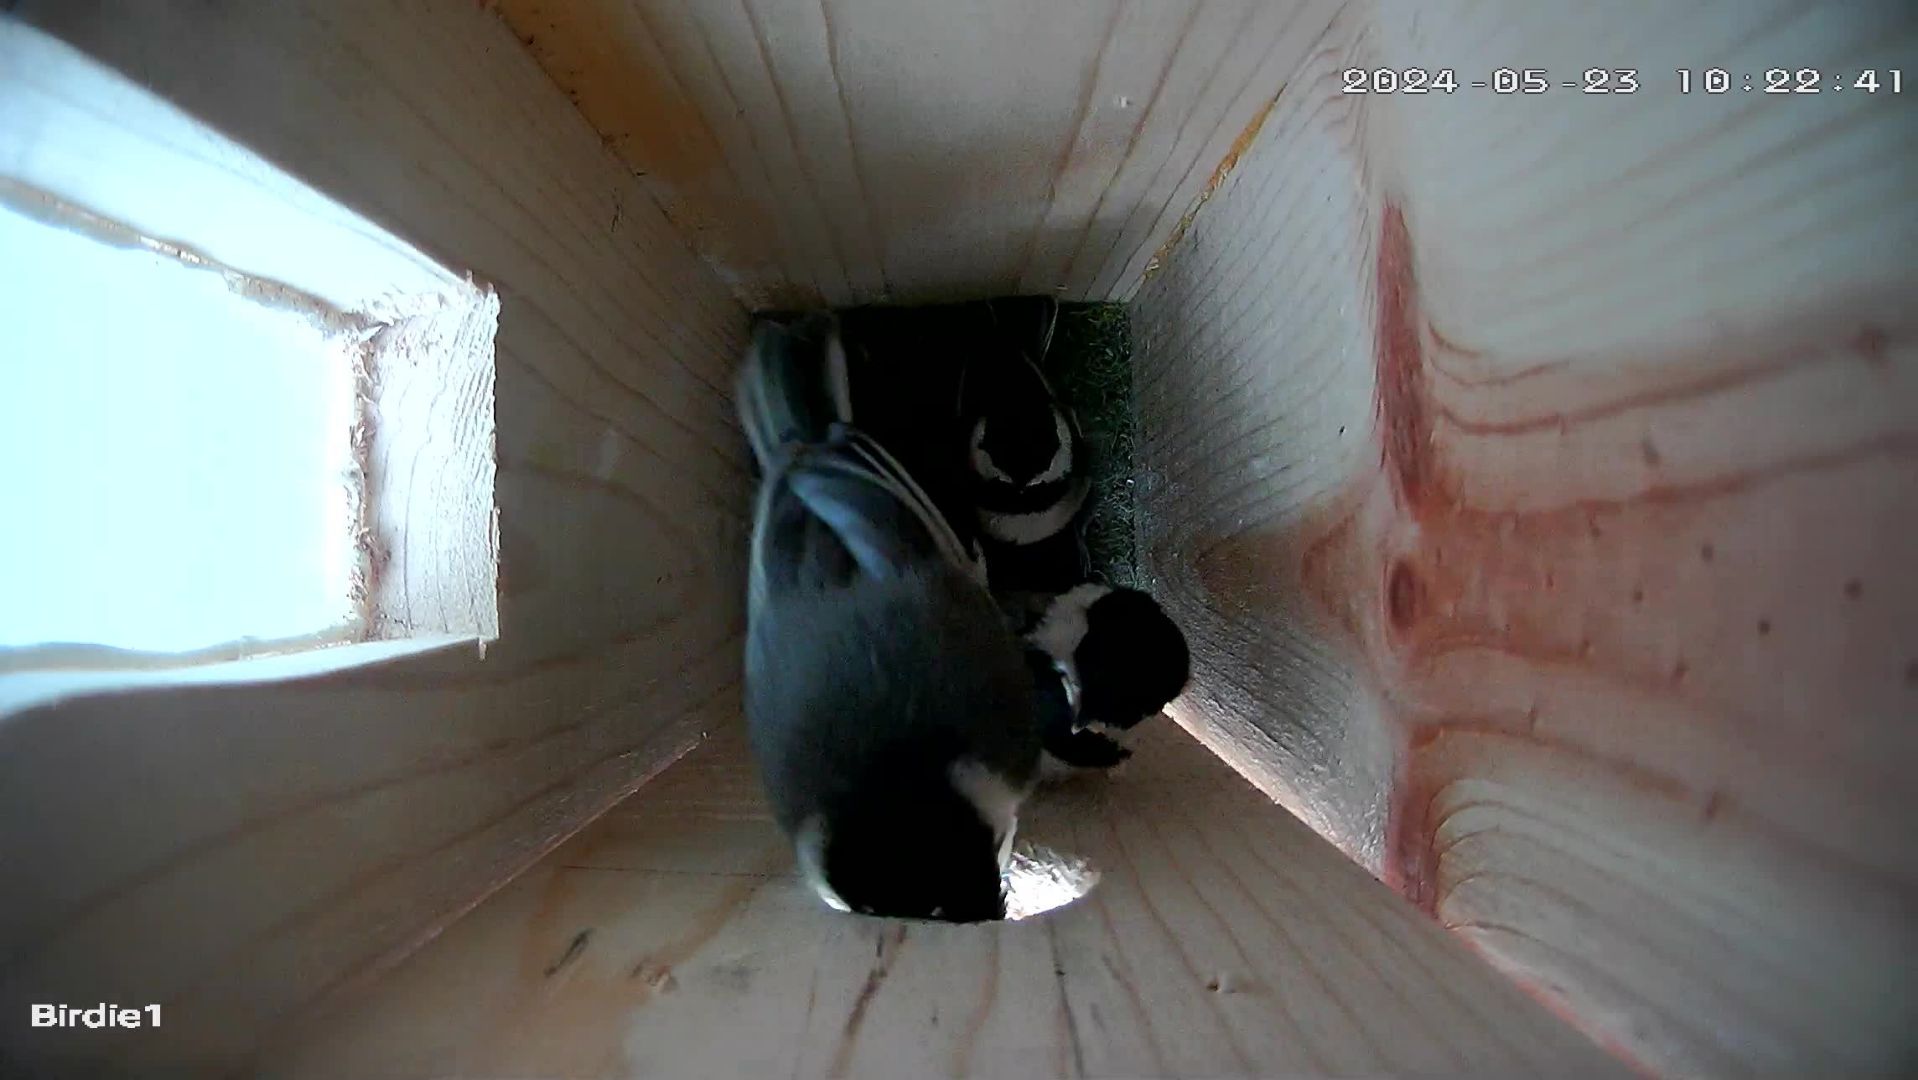
Helping. While one bird has been on the nest much of the time, we noticed another coming in to help out. Perhaps feeding? These black and white images are mostly when the bird house is in the shade or dark. The camera has an infrared light that can be turned on. The birds do not seem to notice.
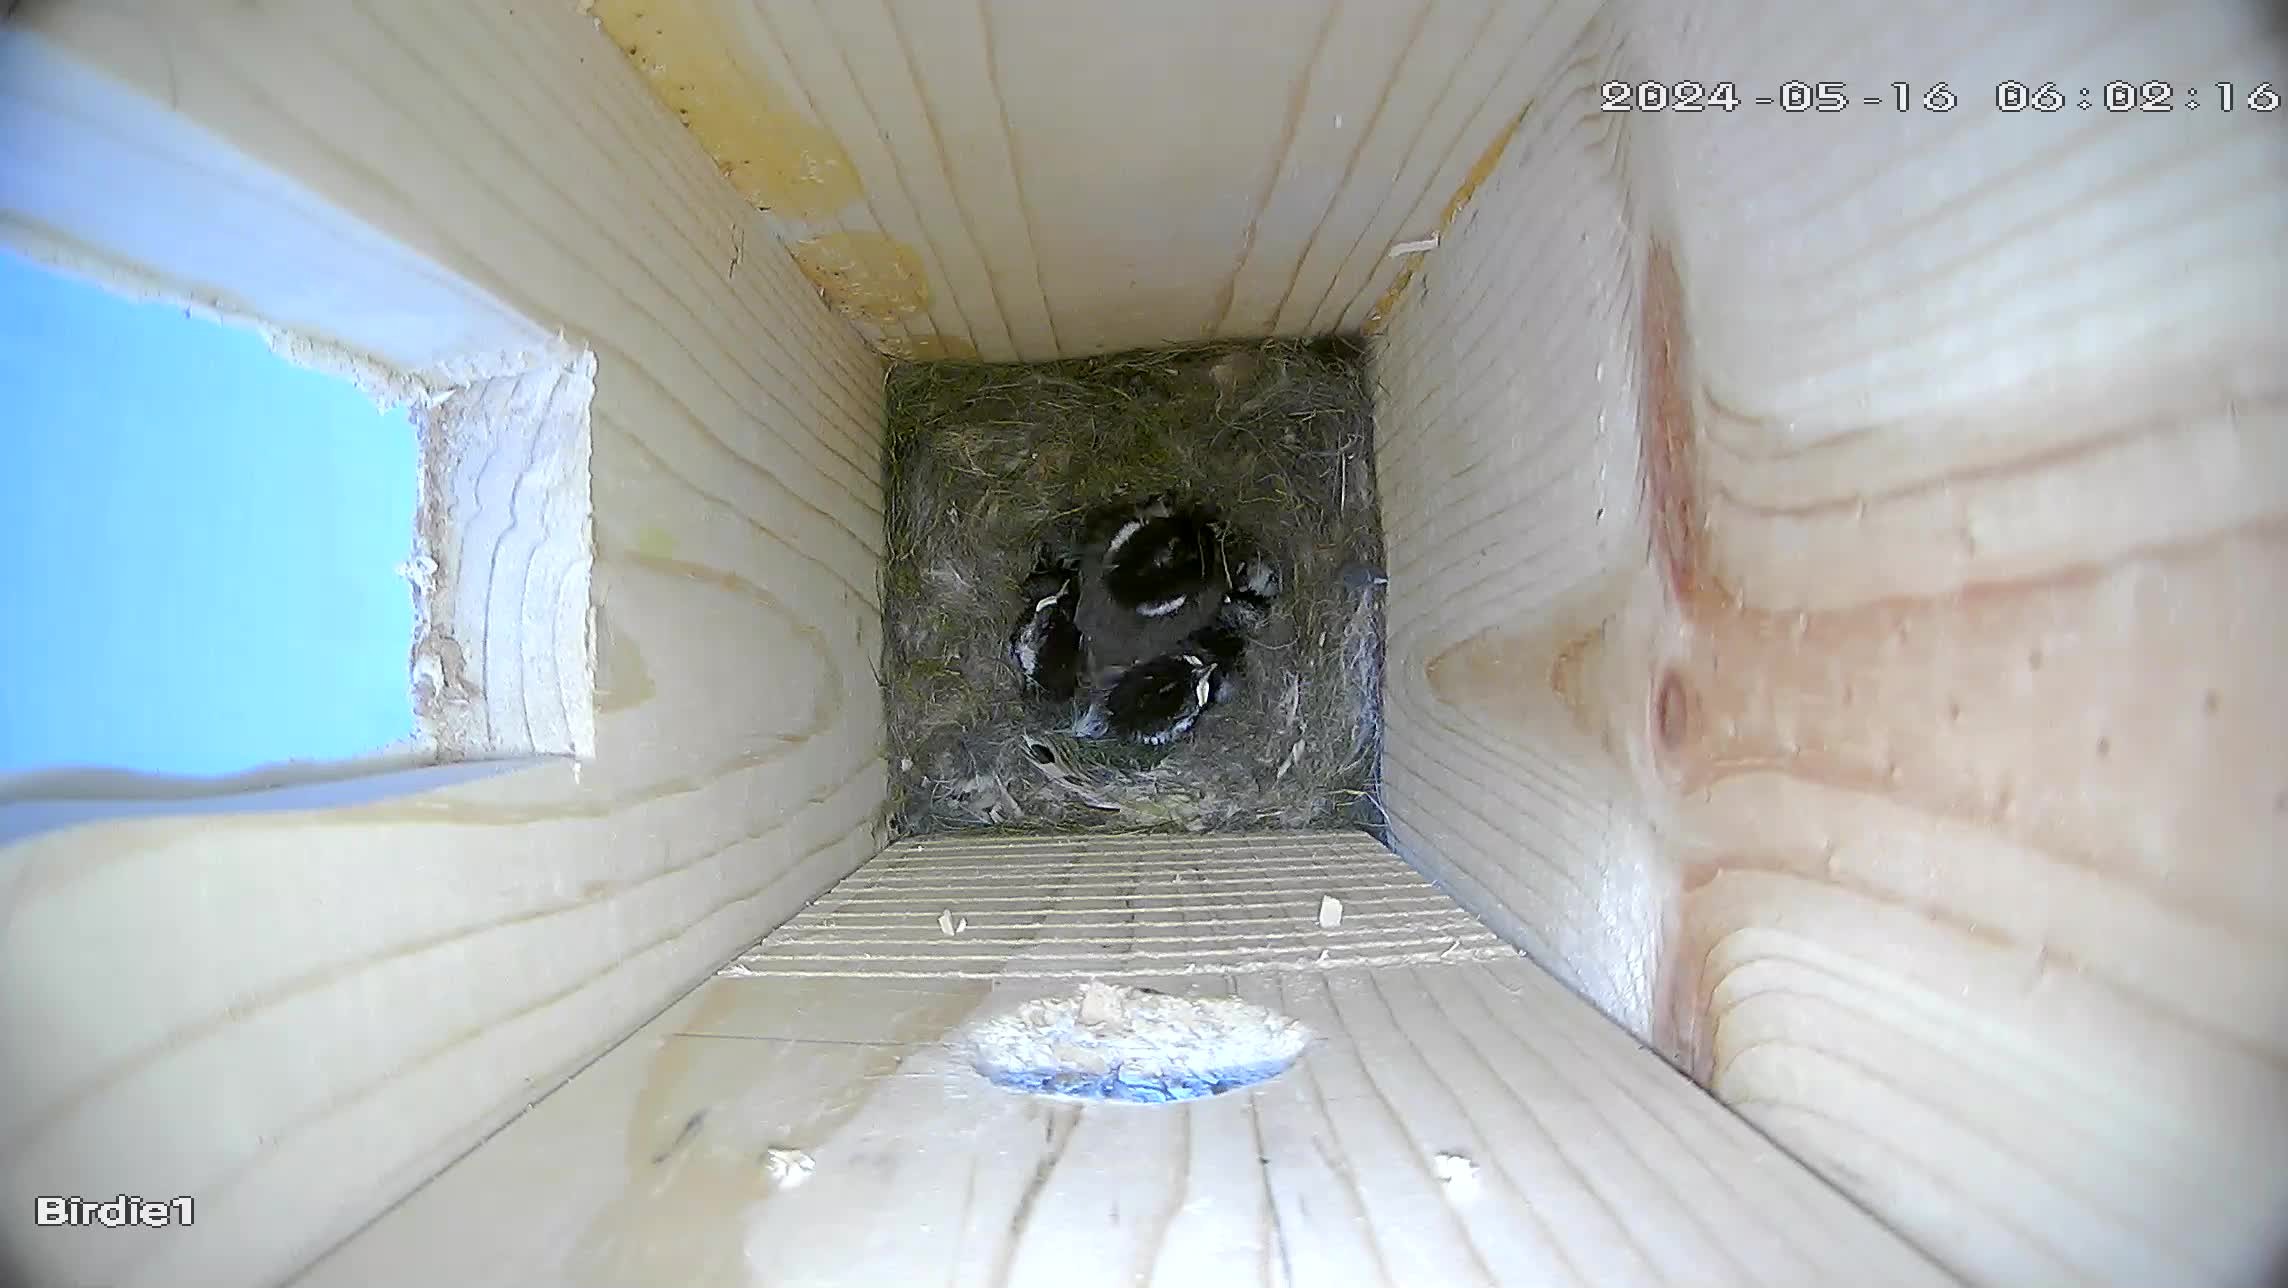
5/15/2024
The chick are feathered out and looking like chickadees.
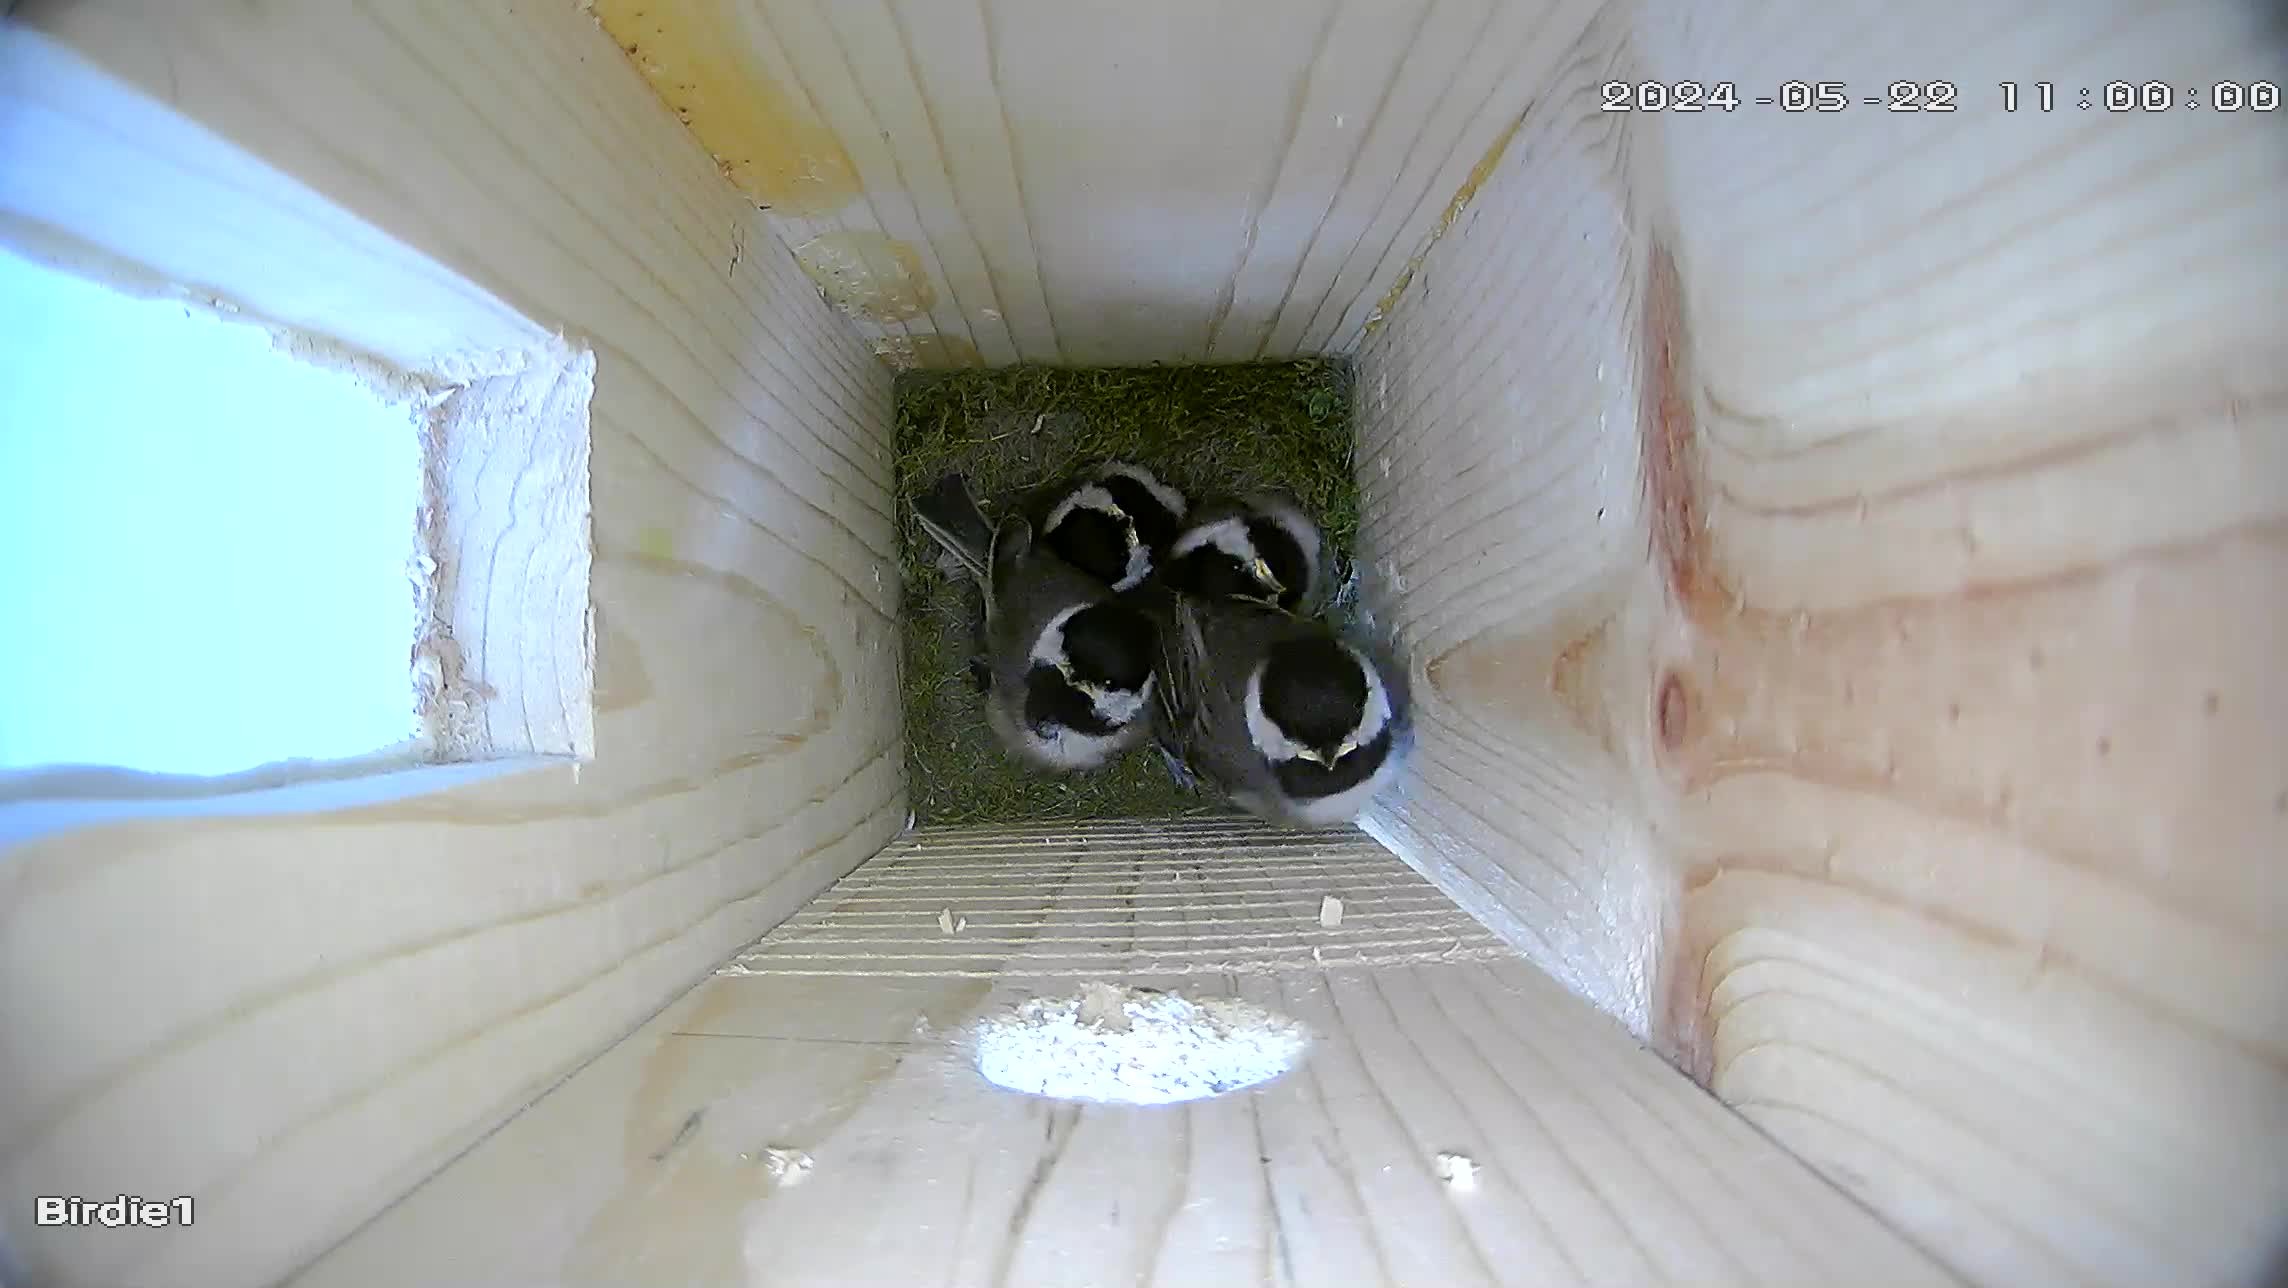
5/21/2024
Wow have they grown, and one has ventured up the grooves to the entrance/exit. It probably won’t be long before the leave. We’ll keep an eye out.
5/24/2024
And just like that, one by one, yesterday they left the nest. From the seven eggs, four birds left the nest.
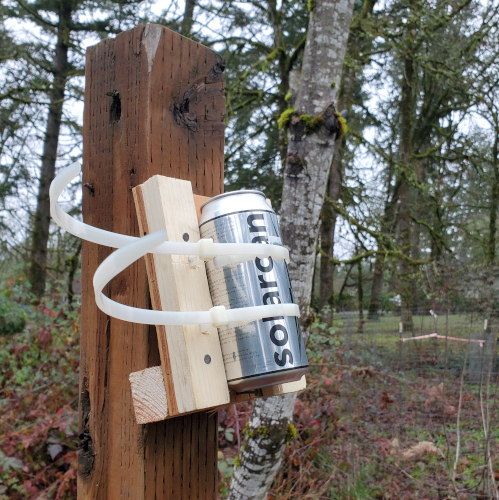
I’m trying out a solarcan, which is a pinhole camera. Attached firmly to a structure and left exposed, it should trace the trail the sun leaves across the horizon each day. I’m starting near solstice, so I should have an every higher track as we head through Winter and into Spring. I’m thinking of leaving it up for 6 months.
For me, this is reminiscent of Clayton Bailey‘s piece that featured a magnifying glass that burns a similar streak across a piece of wood. (Sorry I can’t find a pic.) I really admired that but was unwilling to set that up in my backyard.
I had some data where each item had three attributes. I wondered if some could be related or colletated. I thought plotting the three attributes in three dimensions may show something interesting. My current tools couldn’t do it, I was curious about Python, so I decided to give Python a try. The following are my notes in case I need to travel that road again, or to help someone else.
Step 1. Install Jupyter. I’d tried Python before, but was intrigued by the ability of Jupyter to combine other things besides code in the final product – an electronic notebook. In this case, I really wanted to document what I’d done, so I may do it later. I read that the Anaconda version has an easier user interface, So I went that way, reading up on how to install Anaconda (pretty straight forward) then downloaded and installed Anaconda (Windows). I also allowed it to update.
Step 3. I did a quick check in Jupyter with the code “2+2” and ran it. I got “4”, so that seemed good. I ran that code later, and it did not work, so I restarted the kernal and all was well.
Step 5. The next day I had to find where I left off. Doing a search for Jupyter opened a somewhat mysterious window with things happening but also a web page with my file listed. I clicked on the file’s hyperlink and was back in business.
Step 6. I needed some test data and used Notetab to create a simple table and saved it as a CSV,
I wanted to check the import went okay by displaying the table with header,
spreadsheet.head()
This give us a nice little table with the headers, row numbers, and data. It looked like the csv, so we are okay.
I then import the Plotly Express library, which is supposed to allow for higher level commands that make 3D scatter graphs easier to set up,
import plotly.express as px
Plotly Express uses a data frame to hold the data, so I set the spreadsheet to “df”,
df=spreadsheet
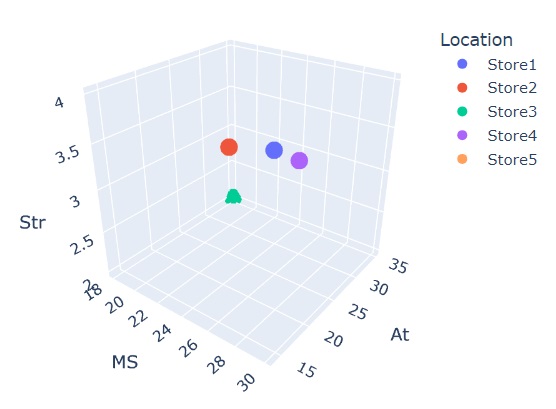
I configured the figure “fig” to use “px” (Plotly Express’s) 3d scatter graph service and chose which colum would be represented by which axis, or color,
Finally, I asked for the figure “fig” to be drawn,
fig.show()
And I have a nice little 3D scatter graph,
Next stop may be to play around with a bit of formatting titles and such, then find a way to include the code on my site so the graph is interactive.
It turns out the data I orginally was going to use was incomplete, so I will not be using it. However, I figure the above would have helped me out, so I’m putting it out there for others. If folks have more ideas, including suggestions about doing a better job, feel free to reach out in the comments.