
Science Advances recently published a paper, “Monthly excess mortality across counties in the United States during the COVID-19 pandemic“, Eugenio Paglino et al, that looked at the number of deaths that were more than expected before and during COVID. From the paper,
Between the first and second years of the pandemic, relative excess mortality decreased in large metros and increased in nonmetro areas. The increases in excess mortality in nonmetro areas occurred most markedly during the Delta wave of the pandemic.
Monthly excess mortality across counties in the United States during the COVID-19 pandemic
The paper included county level data and charts. I was interested in applying my Oregon cartogram experiment to see any patterns. (The paper was published by Science Advance with copyleft permissions.)
Below is a too-small screen shot, as it is really meant to be views as a web page of the cartogram.
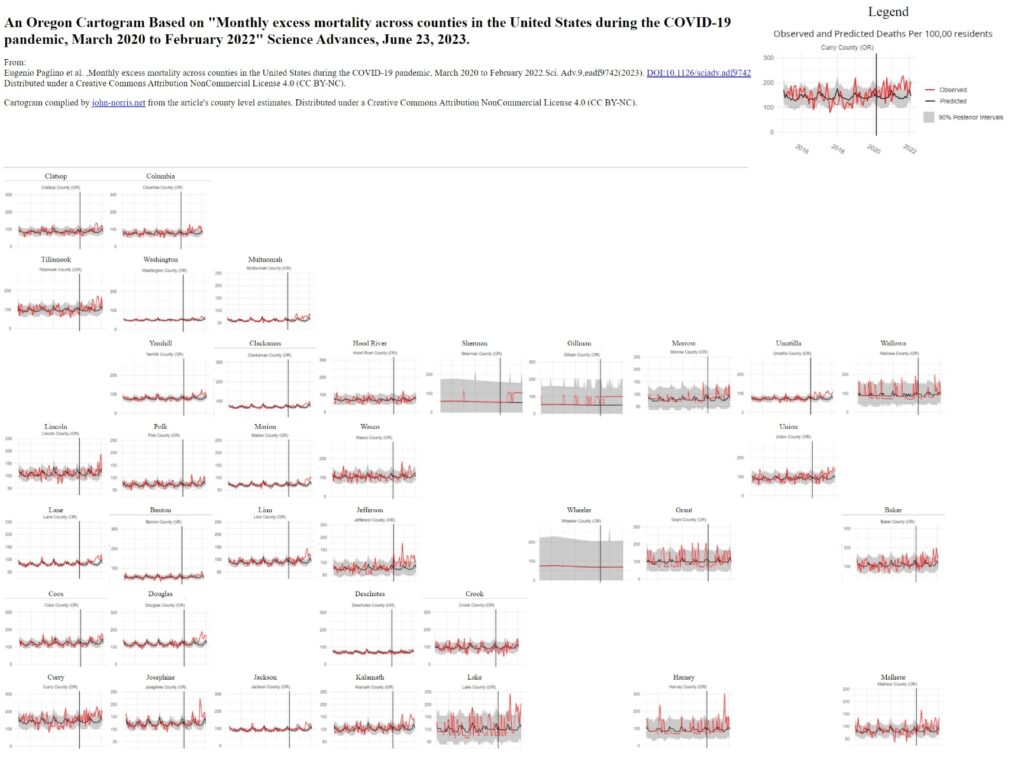
Caveat: This data viz is not a thing of beauty, nor the html/CSS to be proud of, but it was the quickest way I knew how to look at the data in this way. Be careful of the y-axis changes, but to me the interest really lies in how the excess deaths ebbed and flowed over time and not so much the amount.